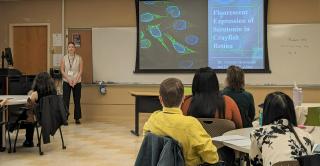
April 27, 9:30 check in, 10 a.m. program starts
Central is celebrating its 175th anniversary. Find details about upcoming events, use an interactive timeline, download special 175th digital assets, and share your Central memories!
Our programs offer an opportunity to learn and grow in a stimulating and supportive environment
Unsure where to begin?
Explore Central helps students find programs that match their interests and abilities.


Beyond The Classroom
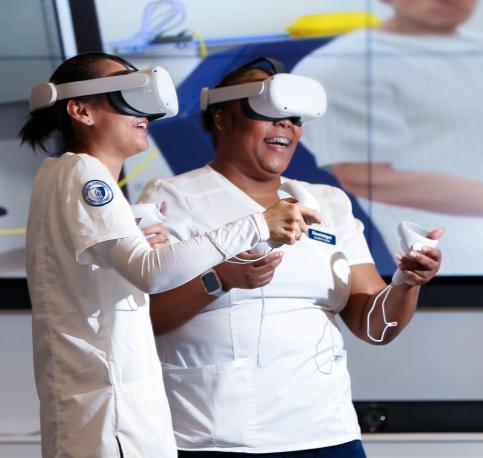
Our academic programs offer real-world experience in a variety of fields, from journalism to archaeology to advertising. You can intern at ESPN, work on an archaeological dig in a neighboring community, or see your work in an ad campaign that airs around the world. These experiences will help you develop the skills and knowledge you need to succeed in your chosen field.
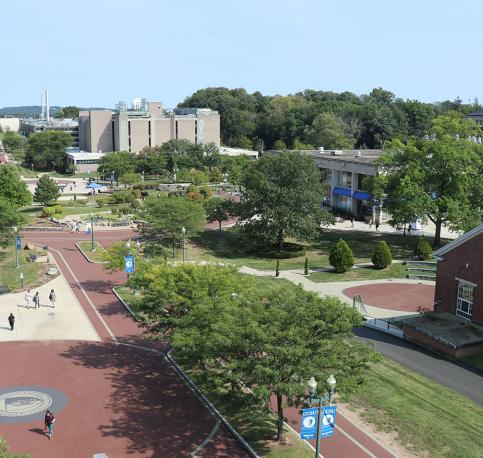
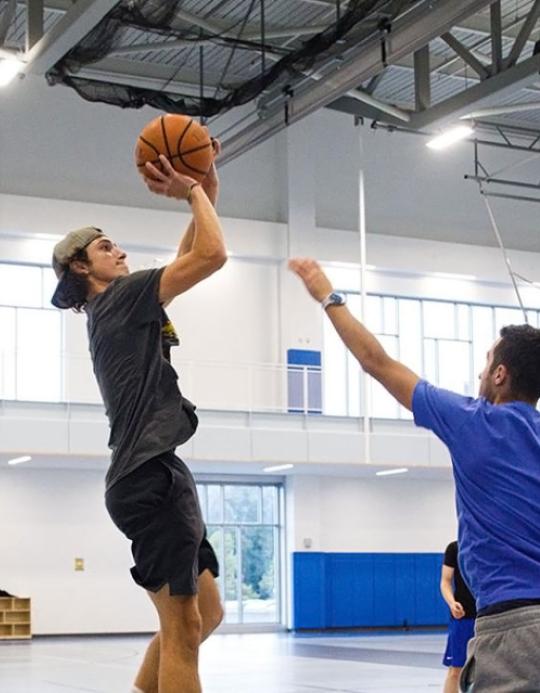
Come Visit Central!
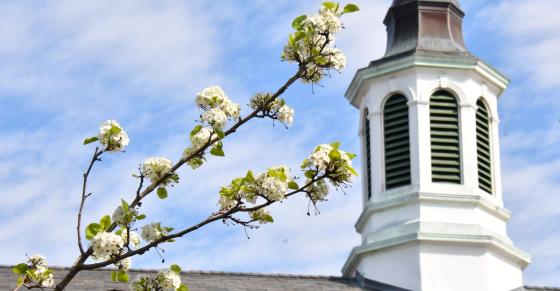
Our beautiful campus in metropolitan New Britain offers state-of-the-art academic buildings, abundant green spaces, safe, accessible walkways, and more, creating a welcoming environment that instills pride in our students, faculty, and alumni.
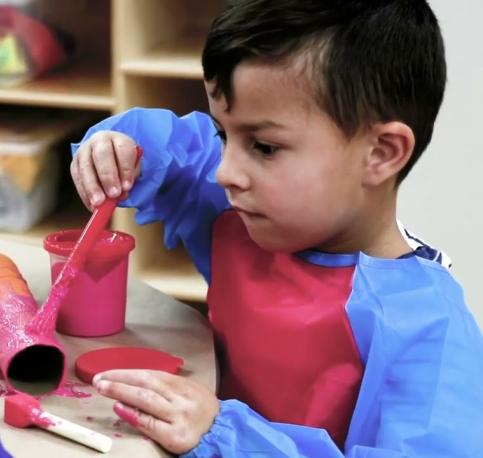
Drop-In Child Care Center
Central's Drop-In Child Care Center is now open on campus! The Center's mission is to provide high-quality educational experiences for children ages 3-12 years old, that is easily accessible and supportive to the needs of our Central students, faculty, and staff.
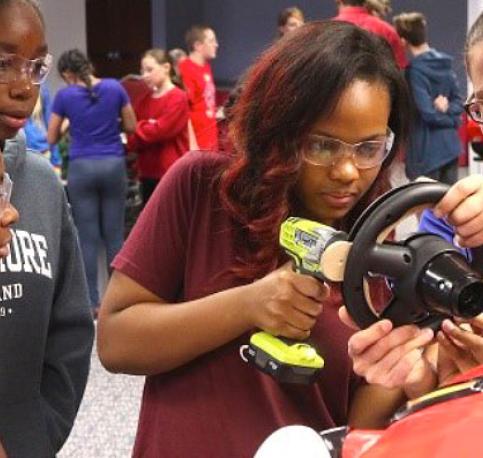
Central In The Community
At Central, you'll find opportunities to learn, grow, and make a difference. Through partnerships with local businesses, nonprofits, and government agencies, you can gain hands-on experience and make a real-world impact. Central is the perfect place to prepare for a successful future. With its commitment to community engagement, Central helps students become engaged citizens who are prepared to make a positive impact on the world.
In 2010, the Carnegie Foundation designated CCSU a Community Engaged Institution.
Choose your path to begin the application process.
Not Sure? Come See For Yourself!